
Making Sense Of Japan’s Epic Stock Market Bubble - 12 Jul 2020
From time to time, Jeremy and myself receive questions from readers that are along this line: “Will the stock market of [insert country] be like Japan’s? Compared to its peak in late 1989, the Nikkei 225 Index – a representation of Japanese stocks – is still 40% lower today.”
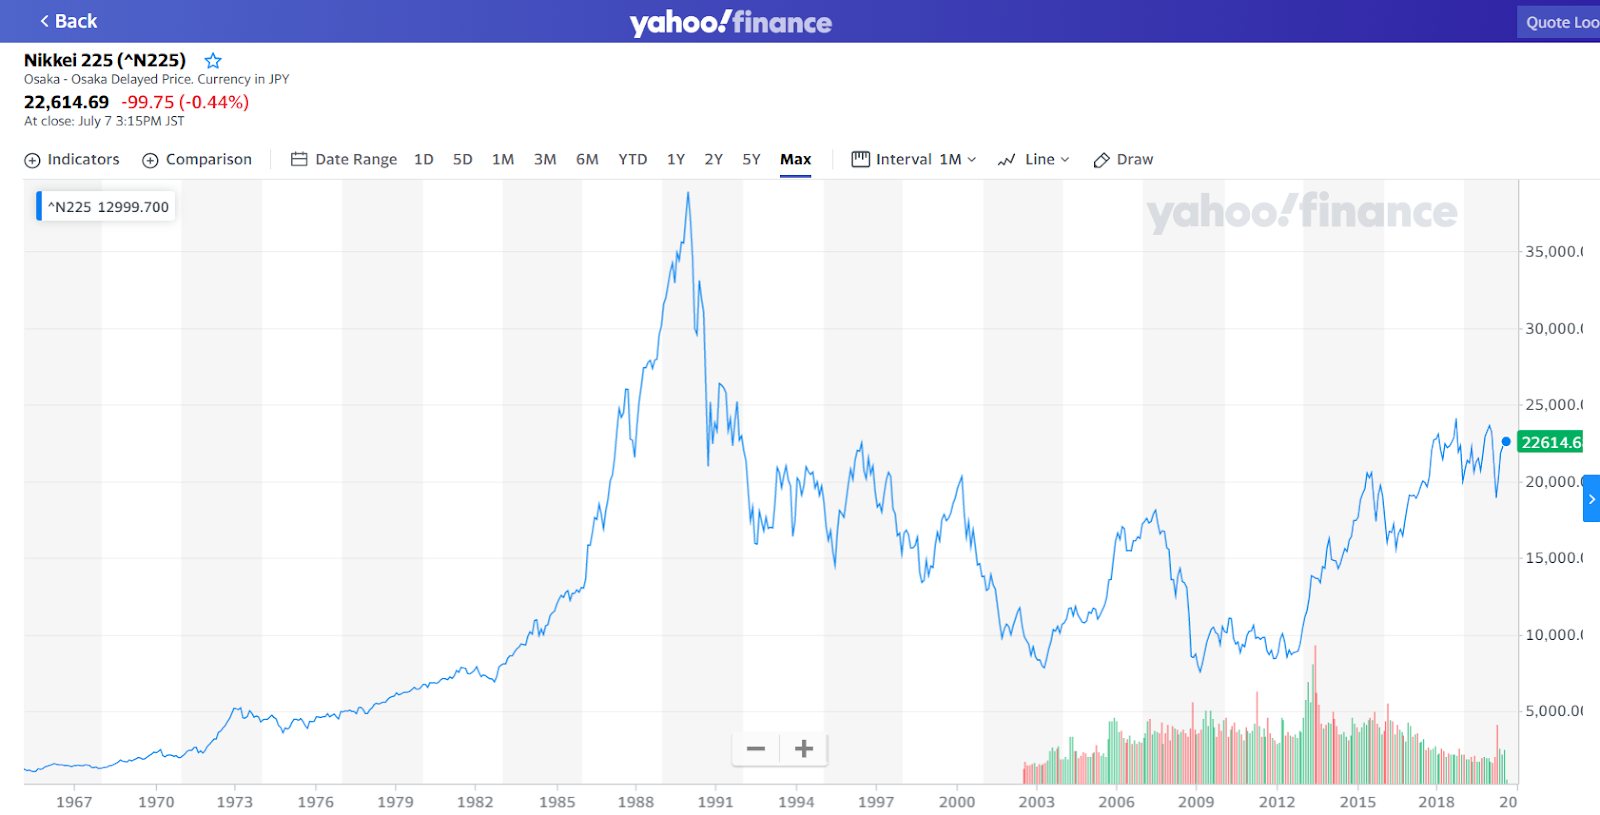
Source: Yahoo Finance
It’s a good question, because Japanese stocks have indeed given investors a horrible return since late 1989, a period of more than 30 years. But perspective is needed when you’re thinking if any country’s stock market will go through a similar run as Japan’s stock market did from 1989 to today. Here’s some data for you to better understand what Japanese stocks went through back then:
- Japanese stocks grew by 900% in US dollar terms in seven years from 1982 to 1989; that’s an annualised return of 39% per year.
- At their peak in late 1989, Japanese stocks carried a CAPE (cyclically-adjusted price-to-earnings) ratio of nearly 100; in comparison, the US stock market’s CAPE ratio was ‘only’ less than 50 during the infamous 1999/2000 dotcom bubble. The CAPE ratio is calculated by dividing a stock’s price with its inflation-adjusted 10-year-average earnings. Near the end of May 2020, Japanese stocks had a CAPE ratio of 19, while US stocks today have a CAPE ratio of 30.
The data above show clearly that Japanese stocks were in an epic bubble in late 1989. It is the bursting of the bubble that has caused the painful loss delivered by Japan’s stock market since then.
If you’re worried about the potential for any country’s stock market to repeat the 1989-present run that Japanese stocks have had, then you should study the valuations of the country’s stock market. But you should note that there are two things that looking at valuations cannot do.
First, valuations cannot tell you the future earnings growth of a country’s stock market. If the earnings of a country’s stocks collapse in the years ahead for whatever reason (natural catastrophe, disease outbreak, war, incompetent leadership etc.), even a low valuation could prove to be expensive.
Second, valuations cannot protect you from short-term declines. What it can only do is to put the odds of success in your favour. I share an investing blog with Jeremy called The Good Investors. In an earlier article I wrote for the blog, 21 Facts About The Wild World Of Finance and Investing, I shared the two charts below:
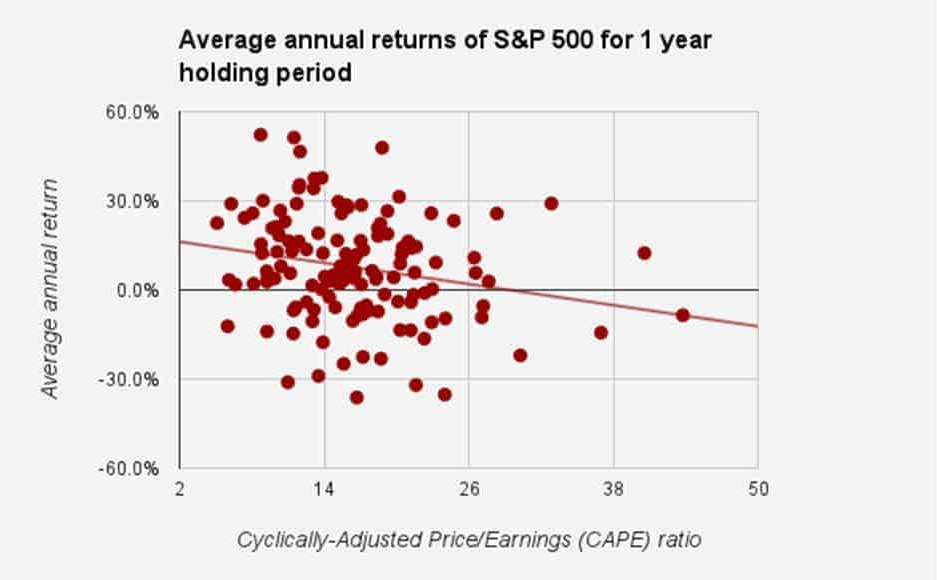
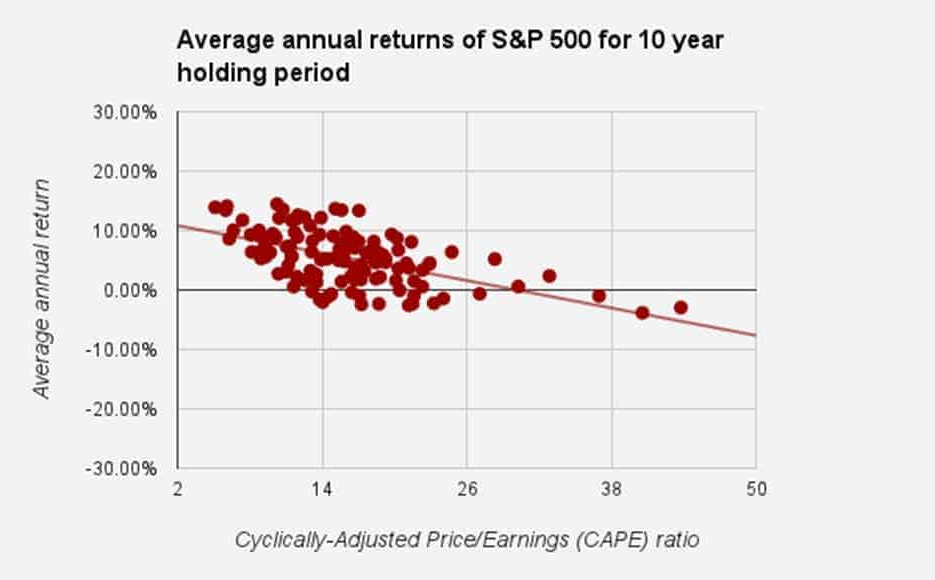
Source: Robert Shiller’s data; my calculation